


P&G's Record Prices - What To Do With Your Stock Options - Part 4 of 4
AN ADDED ADVANTAGE WHEN YOU SIDLE UP TO THE TABLE…
In our prior blogs on the relationship between this famous Kenny Roger’s song and the P&G stock option program, we have examined how trying to decide when to exercise a particular P&G stock option grant is somewhat like trying to know when to “hold ‘em” and know when to “fold ‘em.” Nobody wants to leave a lot of money sitting on the table but nobody wants to lose whatever money they’ve already “won.”
We’ve discussed how using appropriate analysis and mathematical models can enable P&G stock option holders to sidle up to the table with an added advantage—an analytical way of deciding how long to “stay in the game.” We’ve used the February 2012 stock option grant (and for sake of illustration, assumed a grant of 13,000 shares) as this grant has a low strike price relative to the recent P&G stock price of $141 and is also nearing the end of its 10-year lifespan to exercise the option.
YOUR STOCK OPTION VALUE THAT IS AT RISK
In our previous blog, Deciding When to Exercise P&G Stock Options, we introduced the Clarity Wealth Stock Options RatioTM in order to determine the value of a client’s stock option grant. We’ve also discussed how we examine the potential rewards and risks of continuing to hold a stock option grant with the goal of optimizing the value of that grant.
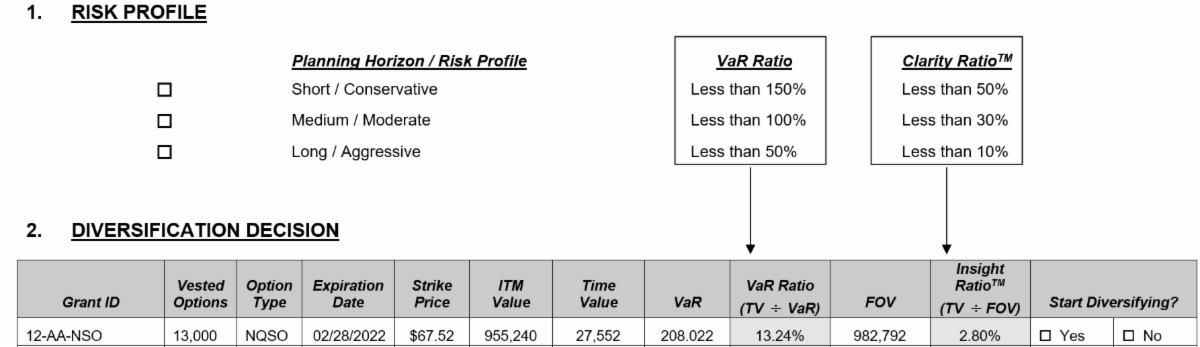
Before we look at our decision matrix, we need to quickly introduce one more valuation and risk measure – the Value at Risk (VaR Value) and the VaR Ratio. These metrics help quantify your potential downside exposure with a stock option grant. As with the Clarity Wealth Stock Options RatioTM , the lower the ratio, the more compelling it is for exercising the option.
Let’s look at these figures then explain what they mean. ITMV value is “in the money market value.” Vested TV is the time value. Vested FOV is the full value of IMTV and Vested TV…

The $208,022 is an estimate of your potential loss using a 5% probability over the next 30 days with the hypothetical volatility or fluctuation of P&G’s stock price. Is this potential loss something you are willing to risk? The VaR Ratio of 13.24% means the theoretical risk of this option is 7.5 times as large as the theoretical potential. Each person’s situation is different, but knowing the potential upside and downside is critical in developing the exercise decision matrix.
THE FEBRUARY 2012 P&G STOCK OPTION GRANT
Going back to our February 2012 example we’ve used in these blogs, as a simplified example, we can illustrate some metrics we present to clients to help them make the ultimate decision as to the timing of a particular stock option exercise and whether to exercise some or all of any particular grant. Of course, every client’s situation is unique and as we’ve discussed in prior blogs, we consider various factors such as each client’s risk propensity, cash flow needs, retirement timeline and income tax considerations. We often find that clients will “dollar cost average” out of their stock options much like someone will dollar cost average into or out of an investment. Obviously, of course, it depends upon how compelling the analysis is or isn’t with regards to the urgency of exercising a particular option grant.
For our 2012 example, we would review with a client the following factors (among others):
- Time to expiration of the grant
- The “Today’s Value” of the grant
- The “Time Value” of the grant
- The “Value at Risk” ratio
- The Clarity Wealth Stock Options RatioTM
- The Risk Propensity Profile of the client
- The risk of or desire for concentration in P&G stock in conjunction with the client’s PST Plan, RSUs and personally held stock
HOW WE CONSTRUCT A STOCK OPTION EXERCISE MATRIX
We then construct a matrix of each grant series with these metrics and update and monitor this matrix over time. A quick glance at a part of the matrix for our 2012 grant example might look like this:
HAVING A WELL-DEFINED PROACTIVE STOCK OPTION EXERCISE STRATEGY
In addition, we put in place for most clients proactive markers for particular P&G stock prices or ratios to alert them and us to the achievement of pre-determined levels of gain or risk. At that point, we already have in place a plan to execute the exercise of the particular P&G stock option grant. Of course, other considerations may affect the timing or execution of the stock option strategy and these can easily be accommodated in the revision of the planning matrix.
The bottom line is that using hunches and emotions to know when to “hold ‘em” and know when to “fold ‘em” might be fine for playing cards but given the enormous potential benefit of P&G stock options to most P&G executives, having a carefully-crafted, well-defined proactive stock option exercise strategy in place is critical to any properly-designed investment and retirement plan. As Kenny Rogers says, you’ve got to “know when to walk away and know when to run!”
Jay A. Finke, CFP®, Matt A. Held, CFP® and Robert V. Molenda, CLU, ChFC, CRPC®